
Genome-wide association studies (GWAS) test hundreds of thousands of genetic variants across many genomes to find those statistically associated with a specific trait or disease. This methodology has generated a myriad of robust associations for a range of traits and diseases, and the number of associated variants is expected to grow steadily as GWAS sample sizes increase. GWAS results have a range of applications, such as gaining insight into a phenotype’s underlying biology, estimating its heritability, calculating genetic correlations, making clinical risk predictions, informing drug development programmes and inferring potential causal relationships between risk factors and health outcomes. In this Primer, we provide the reader with an introduction to GWAS, explaining their statistical basis and how they are conducted, describe state-of-the art approaches and discuss limitations and challenges, concluding with an overview of the current and future applications for GWAS results.

Genome-wide association studies (GWAS) aim to identify associations of genotypes with phenotypes by testing for differences in the allele frequency of genetic variants between individuals who are ancestrally similar but differ phenotypically. GWAS can consider copy-number variants or sequence variations in the human genome, although the most commonly studied genetic variants in GWAS are single-nucleotide polymorphisms (SNPs). GWAS typically report blocks of correlated SNPs that all show a statistically significant association with the trait of interest, known as genomic risk loci. After 15 years of GWAS 1 , many replicated genomic risk loci have been associated with diseases and traits 1 , such as FTO 2 for obesity and PTPN22 (ref. 3 ) for autoimmune diseases. These results have sometimes provided hints into disease biology; for example, a GWAS implicated the IL-12/IL-23 pathway in the development of Crohn’s disease 4 , which supported subsequent clinical trials for drugs targeting the IL-12/IL-23 pathway 5 .
Results from GWAS can be used for a range of applications. For example, trait-associated genetic variants can be used as control variables in epidemiology studies to account for confounding genetic group differences 6 . Further, results can be used to predict an individual’s risk for physical and mental disease based on their genetic profile. Indeed, a recent study showed that genomic risk prediction using genome-wide polygenic risk scores (PRSs) for coronary artery disease, atrial fibrillation, type 2 diabetes, inflammatory bowel disease and breast cancer can identify disease risk as well as monogenic risk prediction strategies based on rare, highly penetrant mutations 7 . Genomic risk prediction may soon be allowed for clinical use as a stratification tool and a genetically based biomarker 7 .
More than 5,700 GWAS have now been conducted for more than 3,300 traits 8 and a push for more statistical power has thrust GWAS sample sizes well beyond a million participants 9,10 , yielding numerous associated and replicable variants for many heritable traits. Now that reliable genetic associations for various phenotypes are known, we are faced with the next big challenge: interpreting these associations in a biological and genomic context. Previous GWAS have shown that most traits are influenced by thousands of causal variants 11 that individually confer very little risk, are often associated with many other traits 8 and are correlated with causal and non-causal variants that are physically close as a result of linkage disequilibrium 12 , making direct biological, causal inferences complicated 13 . Further, genetic associations may differ across ancestries, complicating direct comparisons between groups of individuals. Some of these limitations hamper drawing unambiguous conclusions about the biological meaning of GWAS results, sometimes limiting their utility to produce mechanistic insights or to serve as starting points for drug development 1 .
In this Primer, we aim to provide the reader with a comprehensive overview of GWAS, covering practical considerations, such as experimental design, robust data analysis and data deposition, ethical implications and reproducibility of results. We also provide guidance on how to interpret results from GWAS using several post-GWAS strategies and functional follow-up experiments, as well as a discussion of the above-mentioned limitations and future challenges of GWAS.
The experimental workflow of a GWAS involves several steps, including the collection of DNA and phenotypic information from a group of individuals (such as disease status and demographic information such as age and sex); genotyping of each individual using available GWAS arrays or sequencing strategies; quality control; imputation of untyped variants using haplotype phasing and reference populations; conducting the statistical test for association; conducting a meta-analysis (optional); seeking an independent replication; and interpreting the results by conducting multiple post-GWAS analyses (Fig. 1). At each step, possible biases and errors may enter the study, and therefore careful planning is required when setting up a GWAS, and adherence to standardized quality control and analysis protocols is advised. We detail these steps below. We note that most of the issues that may arise when conducting GWAS, such as carefully selecting participants or the steps that are needed in quality control, apply both to GWAS that include common variants and to studies that include rare variants such as whole-exome sequencing (WES) studies and whole-genome sequencing (WGS) studies; the sections below concern the analysis of common variants, except when explicitly stated (Box 1).
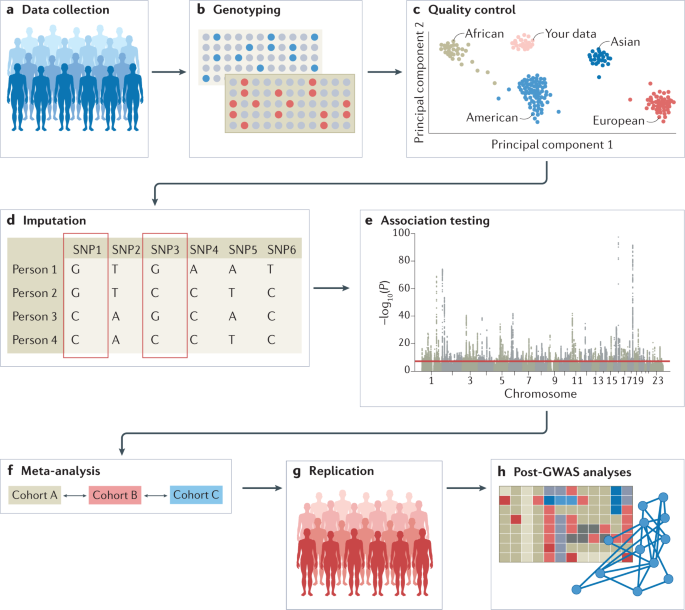
Genome-wide association studies (GWAS) generally involve targeted genotyping of specific and pre-selected variants using microarrays, whereas whole-exome sequencing (WES) and whole-genome sequencing (WGS) studies aim to capture all genetic variation. Strictly speaking, both WES and WGS studies are also GWAS, although in the literature ‘GWAS’ mostly refers to genome-wide studies of common variants and is sometimes considered separate from WGS and WES studies. Declaring a variant as common or rare is population-specific and cannot be generalized across populations. Generally, common variants are those with a minor allele frequency above 10%, although as population sizes grow this threshold can be as low as 1% as researchers typically adhere to a minimum minor allele count; for example, at least 100 individuals who carry at least one copy of the minor allele. With WGS and WES studies just beginning to mature, current analysis protocols may need to be extended to also cover specific issues that arise when analysing rare variants, for example, when controlling for population stratification, or imputing missing genotypes.
GWAS often require very large sample sizes to identify reproducible genome-wide significant associations and the desired sample size can be determined using power calculations in software tools such as CaTS 14 or GPC 15 . Study designs can involve the inclusion of cases and controls when the trait of interest is dichotomous, or quantitative measurements on the whole study sample when the trait is quantitative. In addition, one can choose between population-based and family-based designs. The choice of data resource and study design for a GWAS depends on the required sample size, the experimental question and the availability of pre-existing data or the ease with which new data can be collected. GWAS can be conducted using data from resources such as biobanks or cohorts with disease-focused or population-based recruitment, or through direct to consumer studies. Assembling data sets of a sufficient size to run a well-powered GWAS for a complex trait requires major investments of time and money that go beyond the capacity of most individual laboratories. However, there are several excellent public resources available that provide access to large cohorts with both genotypic and phenotypic information, and the majority of GWAS are conducted using these pre-existing resources. Even when new data have been collected in-house, these will typically be co-analysed with data from pre-existing resources; collecting new data is usually required when more refined phenotyping is desired.
For all study designs, recruitment strategies must be carefully considered as these can induce collider bias and other forms of bias in the resultant data 16 . For example, widely used research cohorts such as the UK Biobank recruit participants through a volunteer-based strategy, which results in participants who are, on average, healthier, wealthier and more educated than the general population 17 . Further, cohorts that enrol participants from hospitals based on their disease status (such as BioBank Japan) will have different selection biases to cohorts recruited from the general population 18 . Different ethnicities can be included in the same study, as long as the population substructure is considered to avoid false positive results. Individual cohorts with detailed clinical measures may not be able to meet the required sample size; in these cases, ‘proxy’ phenotypes that are easier to measure and for which there are more data can be used (for example, educational attainment can be used as a proxy for intelligence, or depressive symptoms can be used as a proxy for a clinical diagnosis of depression) 19 .
Genotyping of individuals is typically done using microarrays for common variants or next-generation sequencing methods such as WES or WGS that also include rare variants. Microarray-based genotyping is the most commonly used method for obtaining genotypes for GWAS owing to the current cost of next-generation sequencing. However, the choice of genotyping platform depends on many factors and tends to be guided by the purpose of the GWAS; for example, in a consortium-led GWAS, it is usually wise to have all individual cohorts genotyped on the same genotyping platform. Ideally, WGS — which determines nearly every genotype of a full genome — is preferred over WES and microarrays, and is expected to become the method of choice over the next couple of years with the increasing availability of low-cost WGS technology.
Input files for a GWAS include anonymized individual ID numbers, coded family relations between individuals, sex, phenotype information, covariates, genotype calls for all called variants and information on the genotyping batch. Following input of the data, generating reliable results from GWAS requires careful quality control. Some example steps include removing rare or monomorphic variants, removing variants that are not in Hardy–Weinberg equilibrium, filtering SNPs that are missing from a fraction of individuals in the cohort, identifying and removing genotyping errors, and ensuring that phenotypes are well matched with genetic data, often by comparing self-reported sex versus sex based on the X and Y chromosomes. Software tools such as PLINK have been specifically designed to analyse genetic data and can be used to conduct many of these quality control steps 20 (further software for quality control analysis and other stages of GWAS are summarized in Table 1). Once sample and variant quality control have been performed on GWAS array data, variants usually undergo phasing and are imputed using a sequenced haplotype reference panel such as the 1000 Genomes Project or TOPMed 21,22 , which involves the statistical inference of genotypes that have not been assayed directly (Box 2). GWAS consortia routinely follow pipelines for conducting quality control steps and imputation, using, for example, RICOPILI 23 or similar software, or upload their data to imputation servers (for example, the Michigan Imputation Server or the TOPMed Imputation Server) where these standardized pipelines have been implemented. Because genetic data sets are typically large and analysis pipelines can be run in parallel, computer clusters or cloud environments that can distribute jobs to many computers are often used. To achieve the large sample sizes typical in genetic studies in a logistically feasible manner that follows data protection rules, the above steps are often done separately for many different cohorts of varying sample size (see section Genome-wide association meta-analysis (GWAMA)).
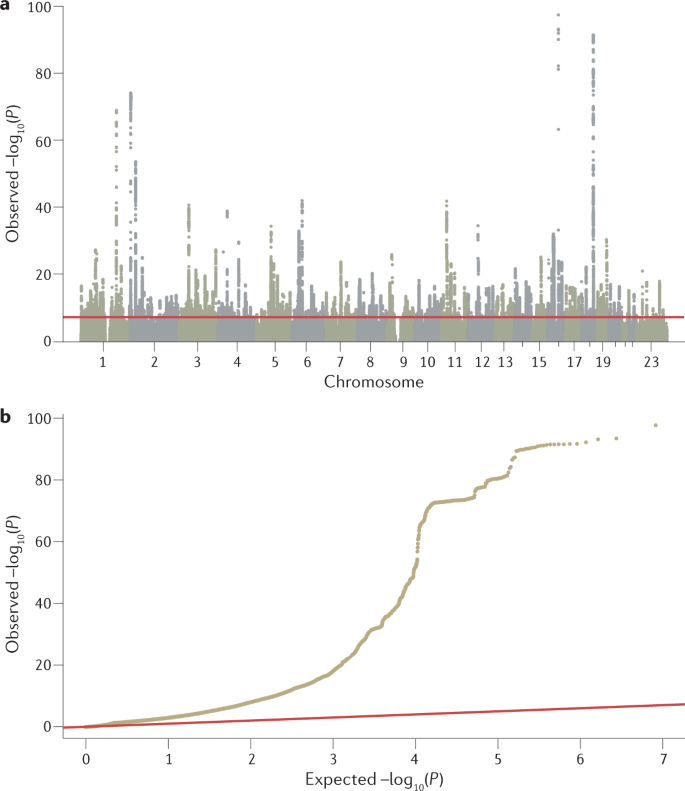
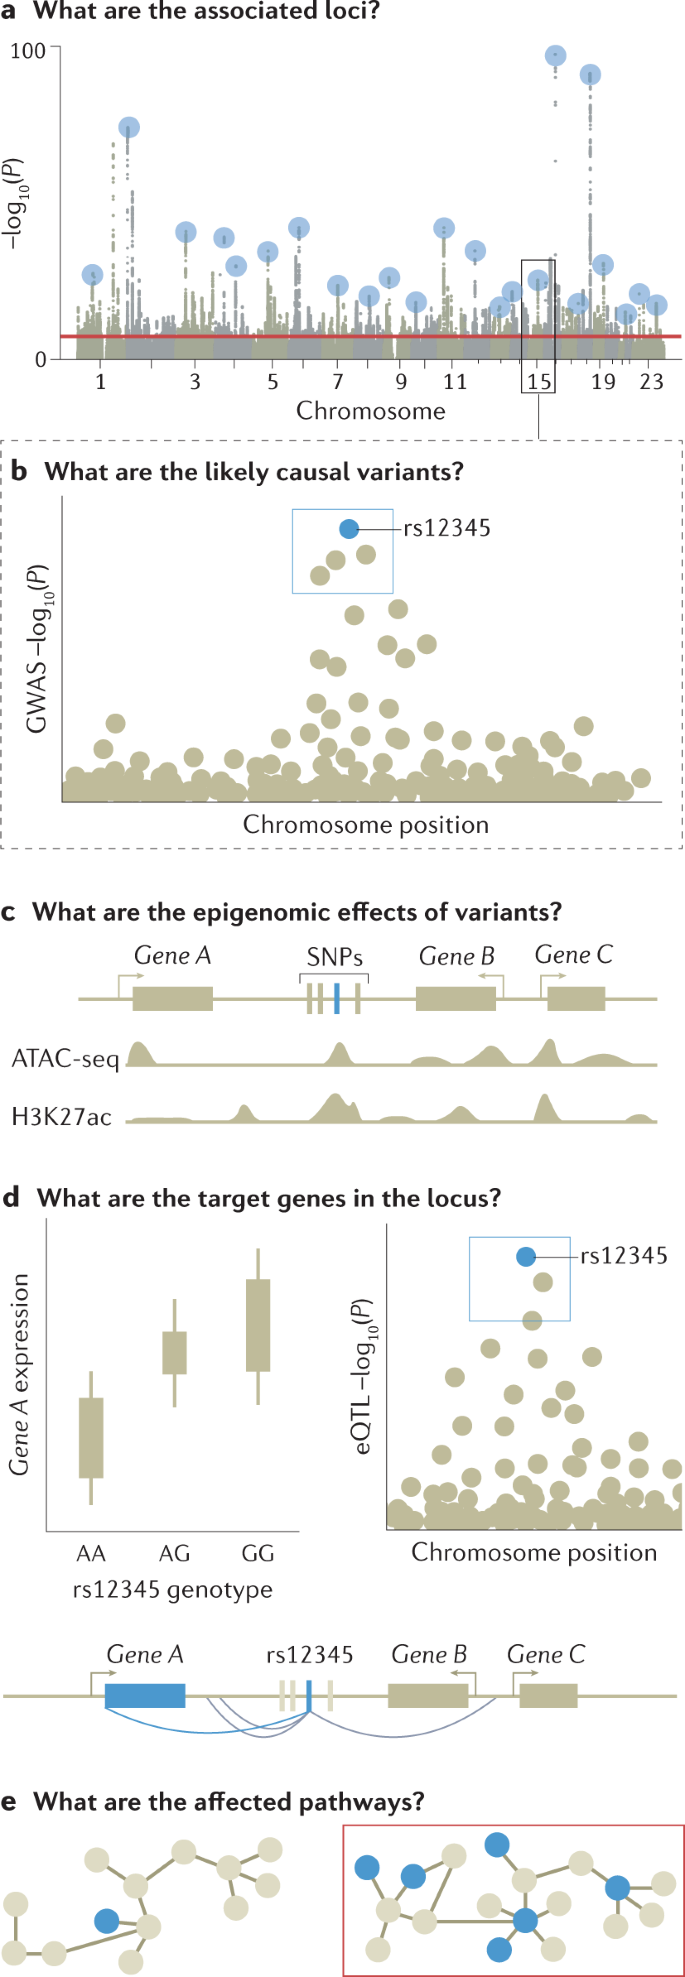
Many non-causal variants are significantly associated with a trait of interest owing to linkage disequilibrium; whether these reach the significance threshold depends on their level of correlation with and the strength of association of the causal variant 12 . The output of GWAS is therefore clustered in risk loci — sets of correlated variants that all show a statistically significant association with the trait of interest — and linkage disequilibrium typically prevents pinpointing causal variants without further analysis.
Fine-mapping is an in silico process designed to prioritize the set of variants that are most likely to be causal to the target phenotype within each of the genetic loci identified by GWAS, based on observed patterns of linkage disequilibrium and association statistics 90,91 . The set of variants that most parsimoniously explain regional association signals are defined as credible variants. The lead variant with the most significant association would be expected to be the most credible causal variant, although there are several situations where the most significant association may be non-causal. For example, where multiple independent risk variants are present in a locus, the combination of multiple signals can shift the most significant association from causal variants to a neighbouring non-causal variant. This can also occur owing to heterogeneity in variant genotype imputation quality, which induces fluctuations in the association signal statistics among neighbouring variants in linkage disequilibrium.
The simplest fine-mapping analysis is a conditional association analysis of the regional variants, which adjusts the regional association signals according to the set of variants in the locus by including the lead variant as a covariate in genotype–phenotype regression models. When multiple association signals exist, forward stepwise selection is commonly used until no associations remain. This method, known as stepwise conditional analysis, is limited to searching all of the combinatory patterns of potential credible variants. This is because the variant search pattern in each iterative step is strongly dependent on the previously selected variant sets and the lead initial step often includes the lead variant. When full genotype data are not available, conditional association analyses can be conducted on summary statistics using GCTA-COJO software 92 .
Several sophisticated fine-mapping approaches are based on Bayesian models, including CAVIAR 93 , FINEMAP 94 , PAINTOR 95 and SuSIE 96 . These approaches optimize the selection of variables for a regression model by using a prior probability distribution, or prior, to estimate a posterior probability distribution, or posterior. An advantage of using Bayesian models over conditional association analysis is that priors can consider additional information such as imputation accuracy in addition to association signals; however, sets of credible variants output using Bayesian modelling are generally not consistent across different methods, especially when multiple independent association signals exist within a locus. In general, the statistical power to correctly detect credible variant sets declines as the number of independent signals increases 96 .
In silico fine-mapping can find credible variants that modulate the expression patterns and functions of causal genes (SNP to gene mapping) or contribute to the development of the target phenotype (SNP to biology mapping). A basic principle of successful fine-mapping is to expand the coverage of the genetic variants assessed by using, for example, WGS-based genotype imputation reference panels 97 . Reference panels with large samples sizes and/or that include other types of non-SNP genetic variants such as insertions, deletions and copy number variants can further expand the coverage of variants for fine-mapping. Recently released large-scale WGS resources with detailed variant annotations (such as the gnomAD 98 and TOPMed 22 databases, which contain >10,000 and >90,000 whole-genome sequences, respectively) serve as valuable resources for high-resolution fine-mapping. It should be noted that structural variants and short tandem repeats are not always accurately captured by current WGS technologies. Further, there are several regions where WGS-based imputation estimates genotypes inaccurately and custom imputation approaches may be needed to fine-map such regions. For example, the genomic region corresponding to the HLA complex (also known as the major histocompatibility complex (MHC)) is highly pleiotropic for various human traits related to the immune system and infectious disease 99 . The complicated linkage disequilibrium structure in this region prevents WGS-based SNP imputation from unambiguously determining their genotypes. The construction of HLA reference panels and custom imputation methods targeting HLA polymorphisms, such as the software packages SNP2HLA (refs 100,101,102 ), HIBAG 103 and HLA*IMP 104 , have provided a catalogue of HLA variant–phenotype association maps 105 . Customized regional imputation methods have also been reported for targeting missing variants at other gene loci; for example, the KIR*IMP software for the killer-cell immunoglobulin-like receptor (KIR) gene locus 106 . Specific resources also exist for use with mitochondrial genomes 107 .
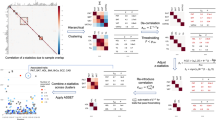
Prioritization of a credible SNP over highly correlated SNPs with absolute linkage disequilibrium is challenging. Fine-mapping of associations from a GWAS for inflammatory bowel disease implicated a single candidate causal variant in only 12% of loci and 1–5 candidate causal variants in 30% of loci 108 , and fine-mapping of a breast cancer GWAS showed similar figures 109 . Prioritizing variants can be improved by integrating functional annotations of the SNPs — for example, expression quantitative trait loci (eQTLs) or epigenomic motifs — into the priors of the Bayesian fine-mapping models. A trans-ethnic GWAS meta-analysis can also help fine-mapping of highly correlated SNPs as differences in linkage disequilibrium structure among ancestries can narrow down the regional windows of associations 91 .
A major motivation for conducting GWAS is to use the identified associations to determine the biological cause of heritable phenotypes and provide a starting point for investigating potential therapeutic interventions. Although GWAS have led to the identification of thousands of complex trait-associated genetic variants 110 and fine-mapping has provided sets of credible SNPs, the biological implications of these variants are typically not easily inferred (with some exceptions 111 ). After fine-mapping, the full mechanistic dissection of a locus identified by a GWAS includes identifying the immediate effects of causal variants (for example, on protein or enhancer function), the affected gene or genes in the locus that mediate the disease association, the downstream network or pathway effects that lead to changes in cellular and physiological function, and the relevant tissue, cell type and cell state for all these effects. Currently, this information exists for only a few loci, such as FTO 112 and SORT1 (ref. 113 ). However, a diverse set of approaches have been developed to infer the molecular effects of variants identified by GWAS.
Prioritizing the likely affected gene is perhaps the most crucial part of the functional interpretation of GWAS loci. For the 2–3% of GWAS loci fine-mapped to coding variants 1 , tools such as ANNOVAR 114 or VEP 115 can be used to infer their potential effect on genes. However, the vast majority of associated, fine-mapped SNPs are located outside coding regions, do not affect protein structure and have unknown regulatory functions 116,117 . The causal gene or genes in the locus — those for which regulatory changes mediate disease association — are often those closest to the association signal 118,119 , although a recent preprint article suggests this is not always the case 120 . One approach for identifying regulatory target genes of genetic variants is molecular quantitative trait loci (molQTLs) analysis, which associates genetic variants with specific molecular phenotypes; for example, eQTL analysis identifies loci associated with RNA expression. The same approach can be applied to other molecular phenotypes such as splicing, chromatin accessibility or methylation status. By integrating this information with GWAS results, trait-associated variants can be mapped to the genes they are likely to regulate in specific tissues and the molecular processes mediating these associations 121,122 . Comprehensive, accessible QTL catalogues are available for community use; for example, the Genotype–Tissue Expression (GTEx) resource catalogues eQTL and splicing QTL for 49 tissues 122 , the eQTLGen resource provides a map of both cis-eQTL and trans-eQTL 123 associations in blood with data from more than 30,000 donors and the eQTL Catalogue has compiled multiple eQTL data sets, as reported in a recent preprint article 124 . The eQTL framework can be extended to transcriptome-wide association studies 125,126 , where gene expression levels are imputed into data from GWAS and tested for association with a trait.
eQTL and splicing QTL approaches suffer from some limitations. As any non-causal variant in high linkage disequilibrium with a truly causal variant will likely show a statistical association with a trait, assigning a functional or regulatory effect to a variant does not automatically mean that the variant is causal. eQTLs should be integrated with GWAS data using co-localization approaches to pinpoint loci where the regulatory association and disease association share the same causal variant 127,128,129 . Further, eQTLs often affect several genes and, therefore, other data sources or functional annotations can be used to prioritize those genes that mediate disease. Finally, molQTL catalogues lack data from many relevant tissues, and data from specific cell types and molecular phenotypes other than expression and splicing are limited. Thus, although molQTL mapping is a powerful and popular approach for creating hypotheses for the regulatory mechanisms and target genes behind GWAS loci, such gene mapping approaches are not as conclusive as those for coding variants (although it should be noted that detectable coding variants for most genes are rare).
As an alternative to molQTL mapping, fine-mapped GWAS variants in enhancers can be linked to genes using methods based on chromatin conformation capture (3C), such as chromosome conformation capture on chip (4C), chromosome confirmation capture carbon copy (5C) and high-throughput chromosome conformation capture (Hi-C), which define regions of chromatin that are frequently in close spatial proximity and may reflect enhancer–promoter loops that control proximal or distal genes 130,131 . Other approaches include correlating enhancer and gene activities 132 and performing large-scale experimental perturbation of enhancers 133 , although enhancer–gene catalogues are far from complete. There is still a need for methods that integrate different types of data for probabilistic prioritization of target genes at GWAS loci.
Recently, the development of highly scalable experimental assays for perturbation of the genome has expanded the functional genomics toolkit. These assays include massively parallel regulatory assays 134 , which test synthetic regulatory sequences by screening variants in thousands of untranscribed or untranslated sequences for functional effects in a single experiment, and CRISPR techniques that allow for the introduction of mutations into the genome and perturbation of regulatory element activity 133,135 . These approaches are increasingly popular and informative, but substantial work is still needed to improve the scalability and interpretability of the data. Although not restricted to existing genetic variation in linkage disequilibrium, they rely, to a large extent, on cellular model systems that may not always recapitulate cells in vivo. Furthermore, the integration of data from both human populations and experimental perturbations is still in its infancy.
Highly polygenic signals from GWAS for any given trait converge on a limited number of biological processes, and the pathway-level effects of genetic variants can be determined and linked to cellular and physiological functions. One approach to achieve this is to test genes identified from GWAS and post-GWAS analyses for convergent functions using tools such as MAGMA 136 and DEPICT 137 . These tools test sets of genes involved in specific biological pathways or linked to specific tissues, cell types, developmental stages or protein networks that are putative, proximal causes of the studied trait for association with that trait. The way gene sets are defined is critical; for example, a randomly chosen set of genes would not be biologically meaningful and sets created based on biological annotations rely on the accuracy of those annotations. We refer readers to a recent resource for defining gene sets 13 . Another approach is to associate genetic variants with molecular changes using trans-molQTL approaches to identify distal genes that are regulated by the GWAS locus. trans-eQTL have been shown to be strongly enriched among GWAS loci and have the potential to pinpoint distal genes regulated by the GWAS locus, although this approach requires molecular data from a large number of samples and the analysis and interpretation can be challenging 122,138 . Finally, experimental perturbation of genes followed by cellular phenotyping is becoming increasingly scalable and informative for interpretation of GWAS loci and genes 139,140 .
Considering the tissue type, cell type or cell state is essential for all functional interpretation work, and particularly important when analysing network effects as genes may have pleiotropic effects across different cellular contexts. For example, tissue-level molecular data can blend cell type-specific signals, further complicating interpretation or masking true signals from rare cell types. Upcoming single-cell and cell type-specific functional genomic data sets 123,141 are therefore likely to advance GWAS interpretation.
Above, we have described how GWAS can pinpoint statistically associated variants and be used to understand the role of these variants in a biological context. The results of GWAS can also be used for applications such as predicting disease risk and understanding the genetic architecture of traits. We discuss several of these applications of GWAS below.
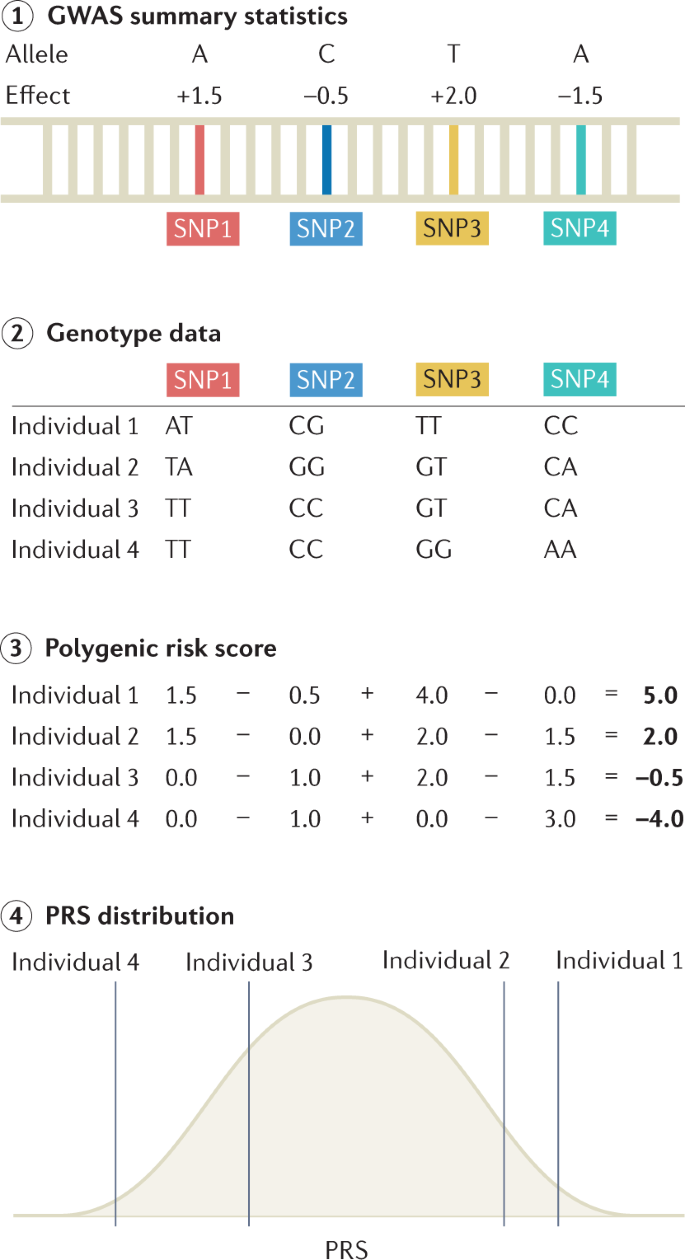
PRSs are commonly used to predict the risk of disease in a target cohort using the GWAS summary statistics of an independent discovery cohort (Fig. 4). PRSs can be used to identify individuals at a high risk of disease for clinical interventions and provide additional information over traditional clinical risk scores for stratified screening. They are calculated as weighted sum scores of risk alleles, with weights based on the effect sizes from GWAS 142,143 . There are many methods for computing a PRS; the simplest and most practical method is pruning and thresholding, which involves selecting subsets of SNPs based on P values of statistical association with the trait 144,145 . More complex methods include those that model the linkage disequilibrium structure, incorporate functional information, weigh the results of multiple discovery cohorts in proportion to genome-wide admixture proportions and consider additional types of genomic or functional information; these methods can improve PRS prediction accuracy through improved estimation of marginal effect sizes 146,147,148,149,150,151 . Accuracy of the PRS can be assessed by various metrics, with the choice of metric based on downstream goals and whether the phenotype is continuous or binary. Accuracy measurements can be inflated if the discovery GWAS and the target cohort share individuals. For continuous traits, the phenotypic variance explained by the PRS is typically quantified as a coefficient of determination (R 2 ). When computing effects of PRSs in GWAS regression models, covariates such as age, sex and ancestry are typically included, and PRS effects are assessed by comparing the difference in explained variance in two models, which can be written as follows:
where H0 represents the model used in the null hypothesis with no effect of the PRS, H1 represents the model used in the alternative hypothesis that does include an effect of PRS on the phenotype and e denotes an error term. Analysis of variance comparing these two models can be performed to determine the phenotypic variance explained specifically by the PRS term and not the other covariates included in the comparison model. For binary traits, pseudo-R 2 values are typically computed using logistic regression models. To ensure that pseudo-R 2 values are comparable across studies and scaled appropriately, these are typically interpreted on the liability scale by adjusting for the prevalence of a trait or disease 152,153 . The maximum predictive accuracy of polygenic scores is determined by the SNP-based heritability of the disease — the proportion of phenotypic variance explained by all SNPs — and the performance of PRS analysis depends on the polygenicity of the disease and the magnitude of the effect sizes of causal variants. One of the best-performing PRSs to date has been developed for glaucoma; individuals in the top decile of the score distribution have a 4.2-fold increase in risk compared with the bottom 90% 154 . A commonly used metric for assessing PRS accuracy is the area under the receiver operating characteristic curve (AUC). The AUC quantifies the performance of the models when the aim is to discriminate between two groups. For the best-performing model, a threshold must be set at which to classify individuals as high risk; choosing a threshold is based on weighing the costs and benefits of false positives versus false negatives, and is thus context-specific and often subjective (see ref. 155 for software that can aid in selecting thresholds). Importantly, metrics such as the AUC or pseudo-R 2 do not necessarily reflect clinical utility 156,157 . A high AUC or odds ratio (the odds of an event given an exposure versus the odds in the absence of an exposure) does not promise an enrichment of high-risk individuals in the top percentile of the score distribution 158 ; a study converting odds ratios into other screening performance measures found that, at a 5% false positive rate, the polygenic score for coronary artery disease proposed in a recent study 7 would miss 85% of individuals with diseases. Reclassification measures such as the net reclassification index are more clinically relevant than odds ratios or AUC curves and can assess the extent to which polygenic scores improve the reclassification of both patients and controls over existing clinical risk predictors 159,160,161,162 .
An obstacle to equitable clinical implementation of PRSs is that their accuracy decays with increasing ancestral distance between GWAS discovery cohorts and the target cohorts. As most discovery cohorts are European, this often results in PRSs that diminish in accuracy with ancestral distance from Europe 163,164,165 . The predictable basis of these disparities can be explained by differences in factors such as minor allele frequencies and linkage disequilibrium across populations. Further, subtle population stratification even within a single population is known to induce regional biases in the baseline values of PRS estimation 29,166 . Increasing diversity in GWAS discovery cohorts is the most impactful approach for improving PRS accuracy for all populations, with most benefit for populations currently under-represented in GWAS cohorts 167,168 .
The Polygenic Risk Score Reporting Standards 169 and the Polygenic Score Catalog 170 , a database of PRSs, have recently been developed to improve the dissemination of PRSs and encourage their application and translation into clinical care. Such continued standardization of PRS reporting and deposition promises to increase the reproducibility of PRSs in the future.
Determining the genetic architecture of a trait involves estimating the number of causal variants, their corresponding effect sizes and their frequencies, and allows the estimation of heritability, or the proportion of variation in the trait that can be explained by genetic variation in the population. Modern large-scale human genetics data sets commonly estimate heritability in genotyped data sets of unrelated individuals. There are numerous statistical methods and computational tools for quantifying heritability 171 . Approaches are typically delineated into broad-sense heritability (H 2 ) — which measures the fraction of phenotypic variation explained by both additive and dominance effects — and narrow-sense heritability (h 2 ), which considers additive effects only 172 . Population-based methods can estimate SNP-based heritability using individual-level genotype and phenotype data; for example, genome-based restricted maximum likelihood, as implemented in genome-wide complex trait analysis 173 , partitions variance component models with a genomic relationship matrix, which allows the regression of the level of phenotypic similarity on the level of genotypic similarity. Alternatively, linkage disequilibrium score regression can be used to estimate SNP-based heritability from GWAS summary statistics and a panel of linkage disequilibrium scores 174 . Importantly, SNP-based heritability only measures the variance explained by additive effects of the genotyped or imputed SNPs. Data discussed in a recent preprint article have highlighted the importance of including rare variants when assessing SNP-based heritability 175 . Indeed, whereas common variants contribute more to SNP-based heritability in a population 176 , rare variants can nevertheless have large effects in individuals 177 . Regardless of approach, heritability is importantly not a fixed entity and varies with age 178 , sex 179 , social factors 180 , phenotype precision and other complex factors. Ancestry heterogeneity is also important to consider, as population structure can inflate heritability estimates 181 .
Although it is informative to know heritability for a single trait, it is often more useful to understand the genetic relationships between multiple traits, as SNPs are often associated with many, sometimes seemingly unrelated, phenotypes 8,182 . Both linkage disequilibrium score regression and genome-wide complex trait analysis allow the estimation of genetic correlations, or the extent to which genetic variants that account for a trait are also important for another trait, provided that the effects are in the same direction. Tools such as superGNOVA 183 , ρ-HESS 184 and LAVA 185 from a recent preprint article allow the estimation of local correlations, determining which specific genomic regions exert genetic effects on the correlated phenotypes in the same or opposing directions. Genetic correlations should be interpreted in the context of SNP-based heritabilities; for example, if these are low for the respective phenotypes, genetic correlation is not expected to play a major part in explaining why two traits correlate at the phenotypic level. Further, genetic correlation does not provide information about causation between two traits. Indeed, genetic correlation can be caused by vertical pleiotropy, where trait A causes trait B; horizontal pleiotropy, where a variant directly influences two traits; linkage disequilibrium-induced horizontal pleiotropy, where two different variants that are in linkage disequilibrium each influence one of two traits; or polygenicity-induced pleiotropy, where multiple variants influence both traits and the underlying patterns are a mix of the above 186 .
Mendelian randomization can be employed to assess causal relations between different phenotypes using GWAS summary statistics 187 . Mendelian randomization is an epidemiological technique that uses genetic variants as instrumental variables acting as proxy measures for an environmental exposure. These techniques can be applied when a randomized control trial is not feasible. Although Mendelian randomization is a powerful design, there are several strong assumptions: the genetic variants used as instrumental variables need to be associated with the exposure; those genetic variants should not be associated with any confounding variables; and those genetic variants are only associated with the outcome through their effect on the exposure 188 .
GWAS for most traits require large (>10,000) sample sizes to yield reproducible results. Such sample sizes can only be generated through collaboration and data sharing agreements. Further, reproducible results depend on sound study design and robust methodology. To further the usefulness of GWAS results, a minimum set of statistics need to be reported. We discuss these considerations below.
One of the key factors driving the success of GWAS was an early commitment to collaboration and data sharing. In 1997, the Bermuda Principles set out that “all human genomic sequence information, generated by centres funded for large-scale human sequencing, should be freely available and in the public domain”. These principles were enforced in the 2003 Fort Lauderdale Agreement 189 , which proposed the continued prepublication release of genomic data as a community resource and suggested a system of responsibility where funders, data generators and data users all carry responsibility to foster the responsible sharing of genomic data before publication. Sharing of prepublication genomic data is now a standard condition of funding for genomics research projects. The existence of many genetics consortia and initiatives such as the Psychiatric Genomics Consortium and the recently formed COVID-19 Host Genetics Initiative 190 build on these initial agreements and are enabled by the willingness of contributors to share and aggregate data. Attempts at fostering the interoperability of genomic databases through the agreement of shared principles and practices for data governance, for instance through the Global Alliance for Genomics and Health 191 , have strengthened the ability of researchers to share and use publicly available genomic data.
Data protections increasingly rely on specific consent by individuals before data can be shared or used. In the European Union, increased privacy protections introduced with the General Data Protection Regulation have introduced stringent requirements for de-identification and consent 192 , which complicates sharing of genomic data both within and between countries. Other jurisdictions, including some in Africa, have equally moved to increase privacy protections 193 . To address concerns about the impact of data protection legislation on research, researchers globally have argued for the development of codes of conduct for the sharing of genomic data in ways that are aligned with legislated data protection principles 194 . Codes of conduct would encourage data controllers or processors such as genomic research institutes to apply data protection provisions effectively and allow them to demonstrate compliance in a way that promotes national and international transfers of data. To date, the development of such codes of conduct has proven to be time and resource intensive, and it is not clear how perceived tensions between privacy concerns and sharing of research data will be adequately resolved. Other potential solutions are the introduction of separate privacy consent forms that particularly cover the use of personal information in research, the preparation of data privacy notices for participants and the completion of data privacy impact assessments for each research project. Several universities across Europe and North America have issued guidance to researchers for the preparation of privacy documents and templates for data privacy documents are available online.
To foster effective collaboration and to increase the use of genomic data — especially for rare conditions — it is essential that genomic data sets are interoperable. In recent years, steps have been taken to develop the tools and approaches that allow for interoperability. Central to this aim are the FAIR (findability, accessibility, interoperability, reusability) principles for scientific data management and stewardship 195 , which are now a condition of funding for many GWAS.
An important ethical challenge relating to the sharing of genomic data relates to ensuring fairness for researchers. A key consideration is that data can be shared in a way that affords researchers across the world equal opportunities to analyse and publish results, including researchers in smaller institutions or based in lower-income and middle-income countries 196 . To address these concerns, initiatives such as the Ebola Data Platform and the H3Africa Consortium have identified principles and practices for governing genomics data to advance equity for researchers from lower-resourced countries 197,198 , including solidarity, reciprocity, transparency and trust 199 . Other broader concerns relate to mitigating harmful uses of publicly available data and ensuring public benefit. To address these various concerns, many international genomic research collaborations have turned to the use of governance frameworks. A recent analysis of these initiatives found five key functions of good governance for data sharing, namely that the governance framework enables data access, ensures legal compliance, supports appropriate data use and mitigates harms, promotes equity in the use of genomic data and uses genomic data for public benefit 200 .
In addition to the sharing of individual-level data, there is also an evolution towards the sharing of GWAS summary statistics. Databases such as the GWAS Catalog 110 and GWAS Atlas 8 allow easy access to summary statistics for thousands of traits (Table 3). Access to and use of GWAS summary statistics can further be improved through adoption of universal data formats, such as the recently proposed GWAS-VCF format 201 . Summary statistics should include the genomic build, SNP ID and location, allele, strand information, effect size and associated standard error, P value, test statistics, minor allele frequency and sample size.
Table 3 Databases of GWAS summary statisticsPreregistration of GWAS can improve reproducibility. In preregistration 202 , all analyses, variables, available protocols, data sets and analytic decisions are pre-specified and recorded before the study is conducted to prevent post hoc rationalizing and ‘HARKing’ (hypothesizing after results are known) 203,204 , which could potentially invalidate statistical inferences and inflate type I error rates. Indeed, these practices have contributed to a lack of reproducible results in genetic association studies 205 . Today, GWAS are generally performed in a hypothesis-free manner, and corrected, reported and published regardless of the results; however, post-GWAS analyses have many more researcher degrees of freedom and are, nowadays, more determinant of publication than the mere number of GWAS hits. Hence, there are more incentives and possibilities for questionable research practices 206 and the benefit of preregistration is greater for these analyses. Analysis plans can be uploaded at the Open Science Framework with a preset moratorium. In a format known as registered reports 207 , peer review occurs before data are collected or analysed and is based on the introduction and methods sections alone. As a consequence, publication is conditional on methodological rigour as opposed to results, which aids in attenuating publication bias 208 . In contrast to preregistration, registered reports are submitted to specific journals that offer this scheme (more details can be found at the Open Science Framework Registered Reports resource). Preregistrations and registered reports are mostly used in data-generating research but can also be beneficial for the more common analysis of secondary data 209,210 .
GWAS have proven to be a highly successful method for identifying trait-associated variants, yet several outstanding methodological challenges still need to be addressed, such as population stratification and high polygenicity. Additionally, GWAS raise a range of ethical issues that require careful consideration, which we discuss below.
Although current methods can address unaccounted-for population stratification, it can still cause spurious or biased associations — particularly in the meta-analyses of multiple cohorts 211,212 . Effects are most pronounced in the analyses of polygenic scores that include thousands of SNPs below genome-wide significance 29,213 . Population stratification can occur even in homogeneous populations; for example, studies have uncovered population stratification and related bias in the UK Biobank, which is predominantly composed of white British participants 214,215 . As current methods for correcting the effects of stratification are based on common variants, such as principal component analysis or linear mixed models, they are insufficient when many rare variants are included in the analyses, especially when population stratification is driven by recent demographic changes 26,30 . Family-based association studies 31,50,216 can avoid stratification, although they tend to be underpowered compared with population-based studies. Significant variants can be identified in population-based GWAS and effect sizes re-estimated in family-based studies to try to obtain estimates that are not confounded by population structure 50,51,211,217 . However, this approach cannot completely eliminate population stratification in PRS data if the lead SNPs identified in the original GWAS are correlated with the environment 30,51 . Further work is needed to better correct for population structure in GWAS and associated analyses. Methods based on principal component analysis of rare variants or identity by descent may be appropriate in cases of recently acquired population substructure.
The extreme polygenicity of many traits 8,11,218,219,220 can pose a challenge when attempting to uncover underlying biological mechanisms, particularly in cases where thousands of variants each have a small effect on a trait 13,221 . To avoid these issues, WES and WGS studies are increasingly being used to discover rare variants of large effect — particularly coding variants from exome sequencing — for which causal mechanisms are generally easier to elucidate 87,222,223,224 . Rare variants of large effect have yet to be reported for all traits and looking for convergence of the effects of thousands of variants remains the best strategy for traits not linked to rare variants of large effect. Further novel methods are needed that address polygenicity and facilitate translating the findings of GWAS into mechanistic insight. High polygenicity also implies that individuals with the same disease may have unique genetic profiles that map distinct biological routes towards the same disease. If genetic heterogeneity is also linked to treatment sensitivity, the development of novel treatments should take this into account. However, as it is mostly unknown how patients should be genetically stratified, this remains an outstanding challenge, with treatments not yet fully tailored to relevant genetic profiles.
In addition to the data protection and equity issues discussed in the Reproducibility and data deposition section, GWAS raise ethical issues relating to consent for future use of samples and data, storage and reuse of samples and data, privacy challenges and sharing data with individual participants. Over the past decade, apparent consensus amongst researchers and bioethicists suggests that broad and tiered consent models that seek permission for sample and data storage and unspecified future use are appropriate 225,226,227 . There is also apparent agreement in the research community that individual genetic research results that are medically actionable, robustly associated with the phenotype and predictive of conditions that are unlikely to have been otherwise diagnosed should be fed back to research participants if they consent to receive such results 228,229 , although this may not yet be possible in resource-scarce contexts 230 .
Arguably, the primary ethical challenge facing GWAS today relates to issues of diversity and inclusion, ensuring that GWAS result in fair opportunities to promote health and well-being for all humans regardless of race, gender or geographical location 231,232 . This means, amongst other factors, proactively working to ensure that the samples and data used for GWAS are representative of the global human population and that the genomics workforce is diverse. Equally important is the leadership that indigenous researchers in different parts of the world have shown in designing culturally appropriate approaches to indigenous genomics 233,234 and the real-time tracking of diversity in GWAS 235 .
The increasing research on and clinical use of PRSs raise questions about the communication of risk information 236,237 and raise issues regarding genetic determinism, the perception that traits are unavoidable and unalterable. First, PRSs have been proposed as a means for embryo selection based on GWAS results, which has proved to be highly controversial 238 . Second, genetic determinism may lead to stigma for patients or their family members 239,240 . Robust community engagement and the development of mitigation strategies are imperative in mitigating the possibility of stigmatization, as is ensuring that research teams have a high degree of cultural competence 234 . Additionally, researchers must not sensationalize or link their findings to pejorative stereotypes; an example of the latter is linking study findings to a supposed ‘warrior predisposition’ of the Maori 241 .
Finally, the growth of direct to consumer laboratory testing 242 by companies offering genetic risk profiles or genetic ancestry information with sometimes questionable scientific validity 243 and recruitment practices where scientists or companies recruit participants via the Internet 244 raise important ethical challenges, including those around scientific evidence, the quality of the informed consent process, maintaining privacy and confidentiality, benefit sharing arrangements and challenges relating to social justice and equity. There are few agreed international guidelines or standards for ethical conduct in situations where GWAS and commercial interests are interwoven and there is great need for their development.
Following the publication of the first GWAS 15 years ago, an impressive number of trait-associated variants have been revealed, along with important insights into biology. Current trends in GWAS include an increasingly interdisciplinary approach, covering statistics, data science, genetics and molecular biology. As sample sizes reach more than 1 million participants and genotyping and sequencing costs reduce, GWAS are increasingly using WES and WGS to allow the identification of rare variants, which could potentially explain much of the missing heritability in complex traits 175,245,246 (however, see ref. 246 for a discussion of potential methodological issues in ref. 175 ). Minimal phenotyping may be a cost-effective and quick way of gaining power 247 and deep phenotyping and item-level analyses 248 are becoming important to further our understanding of distinct symptoms as opposed to diagnoses, which tend to be a collection of symptoms. Finally, the GWAS field is expanding to better represent the global community through the inclusion of under-represented populations.
GWAS could improve on the current low success rates and increasing costs and time required for drug development 249 . Retrospective reviews of drug development projects have shown that studies targeting GWAS disease risk genes were less likely to fail owing to lack of efficacy 250 . Drug discovery efforts have been especially successful when targeting rare variants identified by Mendelian pedigree studies; for example, the indication of an inhibitor of the key cholesterol metabolism regulator PCSK9 for hyperlipidaemia was inspired by the discovery of the rare PCSK9 loss-of-function variant 249 . Identifying drug targets from GWAS results is now a promising area of research. Chemical compounds that directly target the protein products of GWAS risk genes are promising candidates for drug repurposing; for example, CDK4/CDK6 inhibitors for rheumatoid arthritis 251 . Databases such as Open Targets 252 and software such as GREP 253 — which integrate connective networks among GWAS risk genes, compounds and clinical indications — should accelerate the integration of GWAS disease risk genes into drug discovery efforts.
Genetic studies of complex disease may inform the clinical application of therapies. GWAS for measures of treatment responses could allow for the stratification of individuals into responders and non-responders based on genetic factors. Further, integration of multi-omics data and the application of new machine learning approaches to these data sets could further improve patient stratification. A push for personalized medicine based on complex disease genetics seems ethically and economically necessary given that even the highest-grossing drugs in the United States only benefit from 1 in 4 to 1 in 24 patients 254 .
Lastly, GWAS results are now actively used to direct biomedical science in novel, transdisciplinary collaborations between geneticists and domain-specific molecular biologists. The International Common Disease Alliance has assembled a host of funders and scientists in academia and industry with the aim of using genetic disease maps to gain biological and medical insight into common diseases. Similarly, the goal of the BRAINSCAPES consortium is to bridge the gap between genetics and neurobiology by designing and conducting GWAS-informed functional follow-up studies. The promise of the next 15 years of GWAS is thus to gain biological insight into more refined phenotypes, link genetics to biology, develop genetically informed drug treatments, improve clinical risk prediction and ensure that these have positive impacts for the global community.
D.P. is supported by Netherlands Organization for Scientific Research (NWO) grant VICI 435-14-005, the NWO Gravitation project BRAINSCAPES: A Roadmap from Neurogenetics to Neurobiology (024.004.012) and European Research Council advanced grant ERC-2018-ADG 834057. N.S.M. is supported by National Institutes of Health (NIH) grant U24HL135600. J.d.V. is supported by NIH grant U54HG009790 and Wellcome Trust grant 219600/Z/19/Z. Y.O. is supported by Japan Society for the Promotion of Science (JSPS) KAKENHI grants 19H01021 and 20K21834 and Japan Agency for Medical Research and Development (AMED) grants JP20km0405211, JP20ek0109413, JP20ek0410075, JP20gm4010006 and JP20km0405217. T.L. is supported by NIH grants R01GM122924, R01HL142028, 1R01AG057422, 1UM1HG008901 and R01MH106842. H.C.M. is supported by a Wellcome Trust core grant to the Sanger Institute (098051).